In this post, we continue our discussion on the Bohr model and study its applications and implications. In the earlier post, we discussed how Neils Bohr, with his assumptions/postulates, derived formulas for the energy of the electrons, their velocity and the radius of the orbits.

In this post, we shall study how these formulae were useful in the study of atomic structure. Let us learn the applications of the Bohr model –
1) Bohr’s model allows us to calculate the radii of the orbits, that are allowed for an electron, to travel in an atom.
e.g. – For H -atom , n= 1 and Ƶ = 1. ∴r1 = 0.529 ×(12 / 1) = 0.529 Å ≈ 1/2 an angstrom
For He+atom, n=1 and Ƶ = 2. ∴r1 = 0.529 ×(12 / 2) = 0.2645 Å≈ 1/4th of an angstrom.
Thus, as Ƶ ↑ , r(n) ↓
When the charge in the nucleus increases, more is the electrostatic pull experienced by the electron from the nucleus also increases. This results in a small radius.
2) The model allows us to calculate the energy of the electrons in specific orbits easily. We can theoretically calculate the energy of an electron by plugging in the values of ‘n’ and ‘Ƶ’ for any one electron atom in the gas phase.
e.g. – The energy for the ground state electron of a hydrogen atom can be calculated by plugging in the necessary values, n= 1 and Ƶ = 1 and RH =2.18x 10⁻¹⁸ J.
∴ E(1) = – RH × (12 / 12 ) = -2.18x 10⁻¹⁸ J/atom ⇒Energy of ground state electron in H atom.
It is not common to study the energy of a single atom separately. Energy is always calculated for one mole of atoms.
To find energy per mole, we simply multiply the quantity by Avogadro’s number → 6.023x 10²³.
∴ E(1) =-2.18x 10⁻¹⁸ J/atom × 6.023x 1023= -1.312 MJ/mol ⇒ Energy of ground state electrons in 1 mole of H atom.
Thus, the energy of the hydrogen atom (gas phase) in the ground state is 1.312MJ/mol.
We can theoretically calculate the energy of an electron by plugging in the values of ‘n’ and ‘Ƶ’ for any one electron atom in the gas phase.
We can draw an energy level diagram (a diagram that shows the energies of different orbits in an atom) for any chemical species using the Bohr Model.
e.g. – The hydrogen atom (gas phase) energy level diagram –

In the above diagram, the energy of the electron in the ground state is -13.6 eV (we have already calculated this quantity). It is evident that energy (E) is a function of the integer/orbit number ‘n’ i.e as ‘n’ changes, E also changes. Thus, we can represent the energy of orbits as E(n) .
e.g.– For the hydrogen atom, E(1) = -2.18x 10⁻¹⁸ J/atom.
It is convenient to convert the units from J/atom to electron volts (eV) . The conversion factor is – 1.6 × 10⁻¹⁹ J = 1eV
∴ -2.18x 10⁻¹⁸ J = (-2.18x 10⁻¹⁸ / 1.6×10⁻¹⁹ ) = -13.6 eV.
Thus, the energy of an electron in the ground state of a hydrogen atom = -13.6eV.
3) The Bohr model helps to calculate the ionisation energy for certain species and shows us how cations are formed.
It is known that the energy of the ground state electron in the H atom (gas phase) is -13.6 eV. To remove this electron from the atom (i.e. to ionise it or to get it to n=∞), the minimum energy required will be +13.6 eV. This is the ionisation energy of the electron in the H-atom. Ionisation energy is the energy required to remove an electron from an isolated atom/molecule. In this case, the ground-state electron from the H-atom.
∴Ionisation energy of atomic hydrogen = +13.6 eV.

As seen in the above figure, if we provide 13.6 eV to an electron in the ground state of the H-atom, it will absorb that energy and go to n=∞. This means it will be a free electron that is no longer bound by the nucleus of the hydrogen atom.
4) This model can satisfactorily and quantitatively explain electronic transitions that take place in an atom.

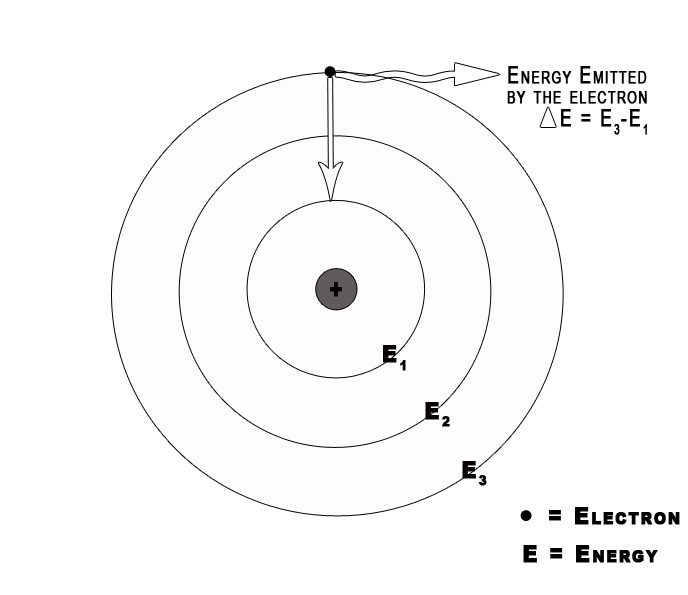
When an electron changes its orbit, it either absorbs or emits radiation. We can study this absorbed/emitted radiation through experiments. The absorption/emission spectra give us information about these changes. Bohr Model helps us to understand this phenomenon. The transition of an electron can be represented by the following formula –
The energy of the absorbed /emitted radiation = Efinal – Einitial
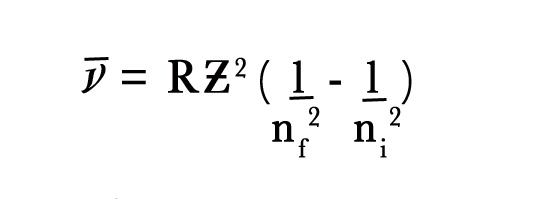
= – RH Ƶ2 (1/n2final – 1/n2initial)
ΔE = – RH Ƶ2 (1/nf 2– 1/ni2) …(1)
Here, ni= orbit number where the electron was found initially
nf = orbit number where electron goes finally.
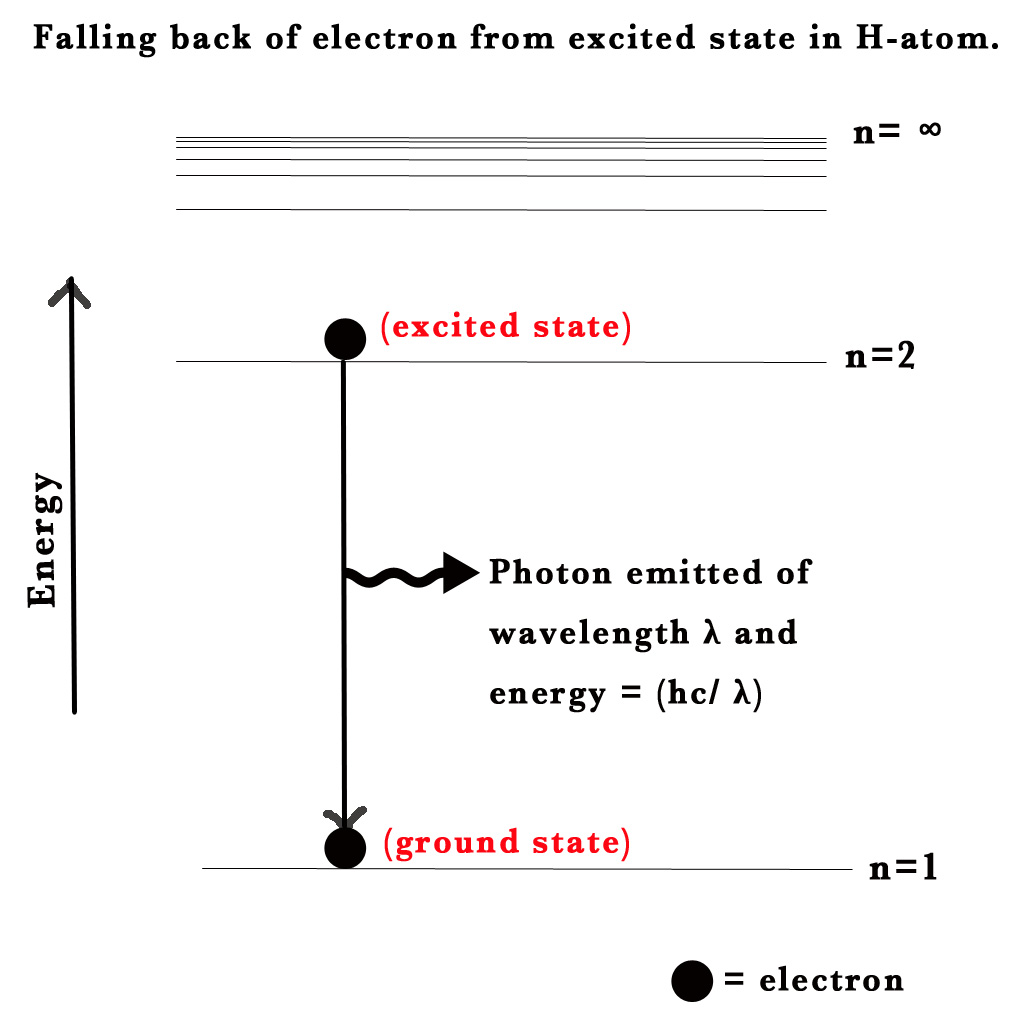
Consider an electron in the ground state H-atom. It absorbs energy and gets excited to the next level. This electron in its excited state is unstable, so it will fall down to its ground state i.e. will go from n=2 to n=1. When an electron drops from a higher to a lower energy level it sheds the excess energy by emitting radiation /a photon.
According to the law of conservation of energy ,
Energy of the emitted photon = ΔEtransition= E2 – E1 = – RH Ƶ2 [1/(2) 2– 1/(1)2)]
Note – An electron bound to an atom can only have certain energies. Thus, the electron can only absorb photons of certain energies.
5) It helps us to calculate the velocity of an electron in an orbit.
e.g. – For atomic H , n= 1 and Ƶ = 1, v = (h/2πma0) × Ƶ/n = 2.18 x 10⁶ m/s.
We know that the speed of light c = 3 ×10⁸m/s.
Why is ‘c’ used as the symbol for the speed of light?
This symbol has its origin in the Latin word ‘celeritas’ which means speed. So, mostly all words with ‘cele‘ in them have to do something with speed. e.g.acceleration, deceleration.
Thus, the speed of the electron moving in circular orbits around the nucleus is around 1% of the speed of light. To understand this speed better, let us convert the speed into km/sec. The speed of light is 2180 kilometres per sec!! Just imagine! We drive cars at the speed of 100 km per hour! And the electron zooms around the nucleus at a speed of 2180 kilometres per second! So an electron could get around the earth in just 18 seconds! Fascinating, isn’t it?
Bohr’s atomic model was a theoretical model constructed based on some assumptions. However, this theory needed to be validated by experimental data. So did any experimental data corroborate this theory? The answer is YES! Let us find out how.
Long before Bohr’s theory was enunciated, a Swedish scientist named Ångström had studied the emissions from gas discharge tubes containing hydrogen gas. He had conducted this experiment in 1853. The experimental set-up was as shown in the following figure-
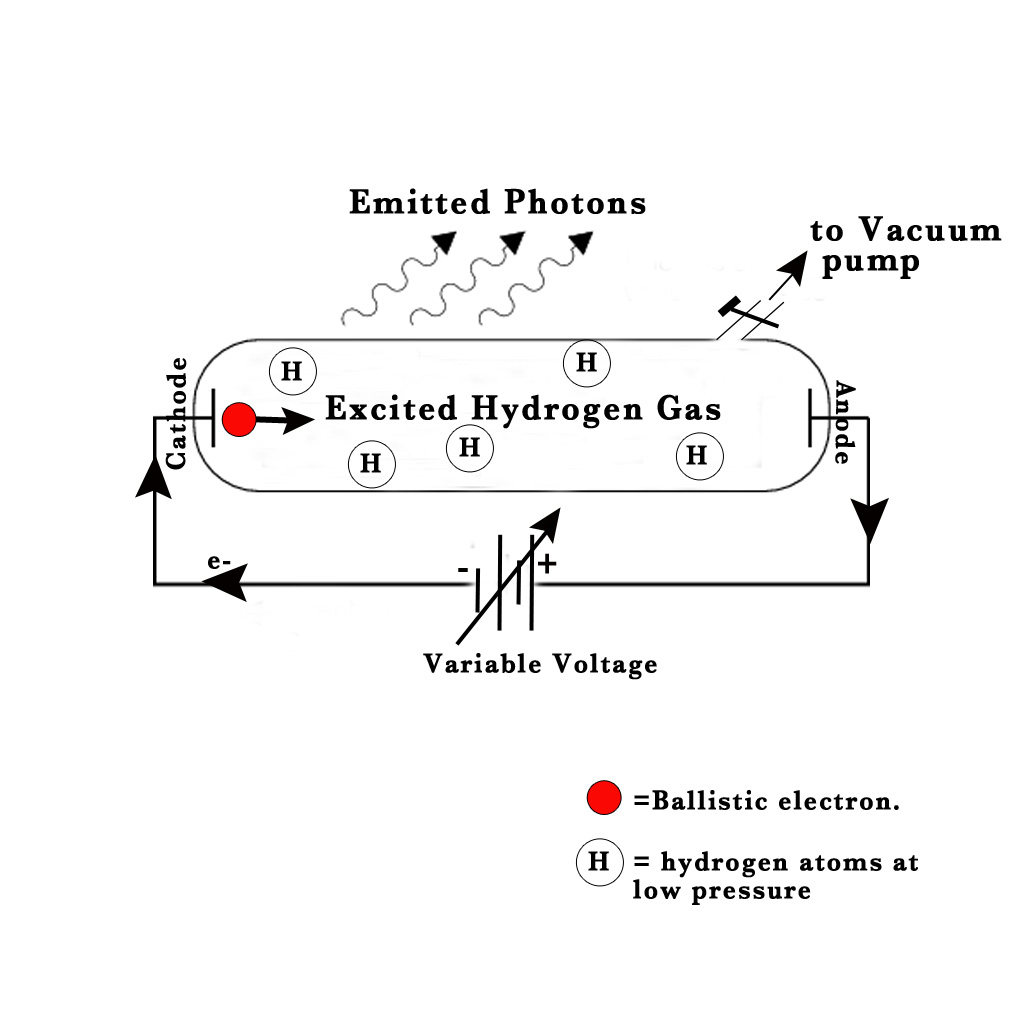
NOTE – The size of the ballistic electron is extremely small compared to that of an H-atom. However, the size shown in the above figure is large to emphasize its importance in this experiment.
Apparatus –
1) Gas discharge tube – made of borosilicate glass.
2) Two electrodes.
3) Variable voltage source, whose voltage can be varied.
4) Vacuum pump
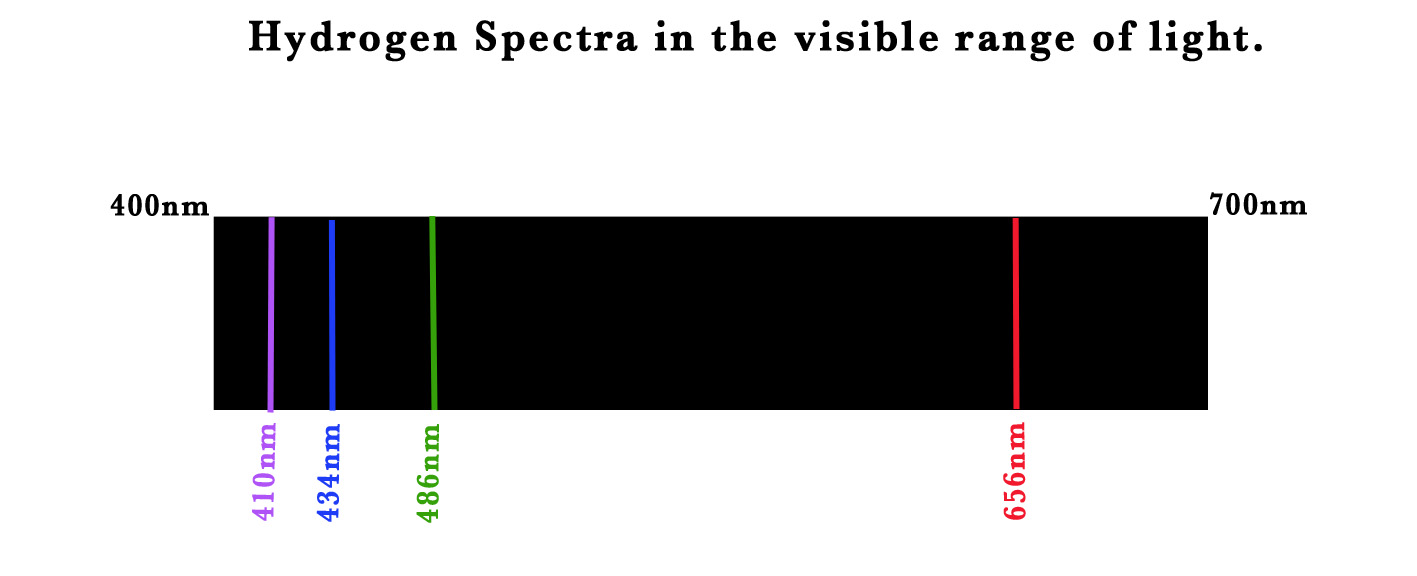
Ångström sealed hydrogen gas in a gas discharge tube at low pressure. Two electrodes were sealed into the tube and connected to a variable voltage source. The electrode connected to the negative terminal was the cathode and the one connected to the positive terminal was the anode. He started varying the voltage between these electrodes. At a high voltage value, he saw a set of 4 distinct lines (through a prism) –
Line colour |
Wavelength |
|
RED |
656nm |
|
GREEN |
486nm |
|
BLUE |
434 |
|
VIOLET |
410 nm |
He studied these lines and found out that these lines were exclusive to the hydrogen atom. The structure of the hydrogen atom was not known at that time. Thus, the appearance of these lines could not be explained. After 50 years, the Bohr model could satisfactorily explain this phenomenon! The concept of quantised orbits explained the occurrence of the specific lines. Let us study how the theory helped explain these observations.
As the voltage in the experiment is raised, at a particular high voltage value, the electrons from the cathode start to boil off the surface. They then go zooming through the discharge tube towards the anode (as electrons get attracted to the positive charge).These electrons which are ejected from the cathode are the ‘ballistic electrons‘ (shown in red color in the above figure). Sometimes, while travelling from cathode to anode they collide with an H – atom in their path.During these collisons the ballistic electron transfers energy to the electrons present inside the H-atom. Thus, the electrons present inside the H-atom get excited to higher energy levels. However, they are not stable in this excited state. The excited electrons fall back down to the ground state and emit photons. These emitted photons have different energies depending on the various electronic transitions taking place inside of the H atom.
So, conceptually the Bohr theory successfully explained the discrete lines seen in the hydrogen spectrum. However, scientific data has to be quantitative as well. Let us study the story of this quantitative conquest –
Ångström saw the discrete lines at particular wavelengths namely (656nm, 486nm, 434nm, and 410 nm) from a hydrogen gas discharge tube –
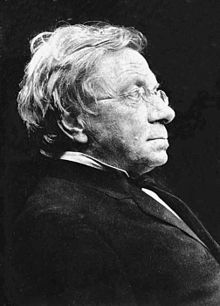
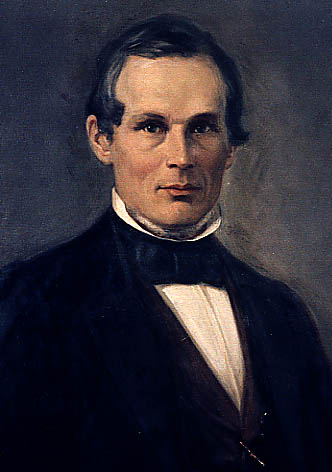
J.J. Balmer was a Swiss mathematician. In 1885, started studying Ångström’s experimental data. He was trying to find a pattern in the numbers 656,486,434 and 410. He successfully came up with an equation to represent those lines. He took a reciprocal of the wavelengths i.e. wavenumber, and derived an equation as follows –
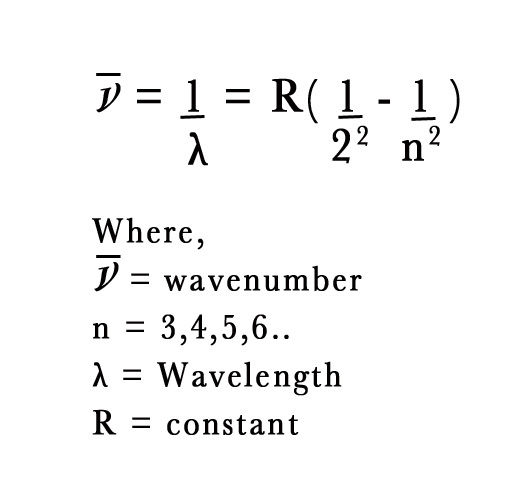
In the above equation the value of the constant R = 1.1 × 10⁷ m -1.
It was already known that,
Rydberg constant RH = 1.097 × 10 7 per metre and
Bohr’s constant K = RH.
RBalmer= KBohr = RH
All the three constants are equal. This was the quantitative proof of Bohr’s theory. Balmer’s interpretation of Ångström’s experimental data proved that the Bohr Model was correct!!
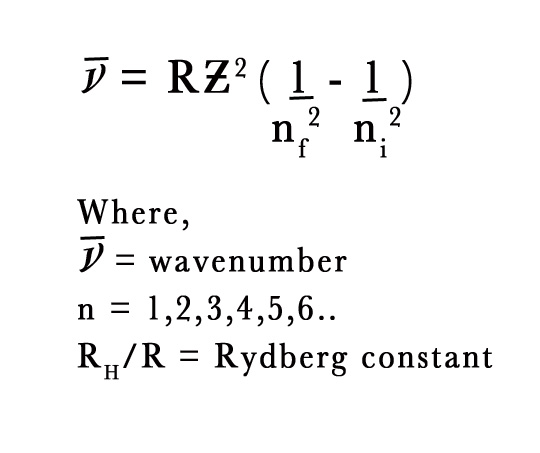
The following is the Rydberg Equation is a general equation for one electron atom,
NUMERICAL –
- He+ electron goes from n=4 to n=2. What is the wavelength of the photon emitted?
Solution –
We know,
∴1/λ = (1.1 × 10⁷ m -1) (2)2[(1/(2)2– 1/(4)2]
=(1.1 × 10⁷ m -1) (4) [(1/4) – (1/16)]
= (1.1 × 10⁷ m -1)(4) (0.1875)
1/λ =0.825× 10⁷ .
∴ λ = 1/ (0.825× 10⁷)
λ = 1.21 × 10⁻⁷ m.
In our next post, we shall discuss hydrogen spectra with the concepts of the Bohr model. Till then,
Be a perpetual student of life and keep learning…
Good Day !
Further Reading and References-
1)http://chem.libretexts.org/Core/Physical_and_Theoretical_Chemistry/Quantum_Mechanics/10%3A_Multi-electron_Atoms/The_Bohr_Atom
2)Lecture 4 ,MIT, 3.091SC Introduction to Solid State Chemistry, Fall 2010 by Professor Donald Sadoway.
3)http://astro.unl.edu/naap/hydrogen/transitions.html
Image sources –
1)https://upload.wikimedia.org/wikipedia/commons/thumb/5/51/Balmer.jpeg/220px-Balmer.jpeg
2)https://upload.wikimedia.org/wikipedia/commons/9/9a/Anders_Ångström_painting.jpg
