Galileo said – “Mathematics is the language with which God wrote the universe” .
Mathematics is of paramount importance to the study of any science. I get freaked out at the sight of integers, logs, and calculus. However, these concepts are an indispensable part of our study. So, in the next few posts, we shall study some basic concepts in Mathematics. These concepts are needed for discerning many Chemistry topics. Without a general idea of these concepts, it is tough to properly understand what we are about to discuss in future posts.
Why do we need Mathematics in any science?
A scientist conducts experiments only a finite number of times. Based on the observations of the experimental data, one needs to find a general relationship between the quantities being studied. This is where mathematics comes into the picture. Mathematical modeling helps us to generalize the relationship between the variables under study and later use it for any value whenever required.
VARIABLES
In simple words, variables are quantities that vary! The quantities that change during the experiment, which do not have fixed values are called variables. Variables are denoted by alphabets like x, y, m, n, etc. Thus variables are alphabets used in place of unknown quantities. Variables are quantities that are not constant.
Generally, we study the dependency of one variable y on another variable x. We conduct an experiment where we keep changing the value of x and study how y varies with it. We then find a relation between x and y from the experimental data.
e.g. Consider an experiment where we vary one variable ‘x’. The hypothetical values of ‘y’ obtained from the experiment are as follows –
| x(Independent variable) | y(Dependent variable) |
|
1 |
1 |
|
2 |
4 |
|
3 |
9 |
|
4 |
16 |
When we study the above experimental data, we find a relationship between the values of x and y. We can thus formulate a mathematical expression relating both values. In this case, the equation would be, y= x2. If we need to know the value of y when x=9, we don’t have to conduct the experiment again. We just need to plug in the value of x in the above equation! Plugging in the value of x, we get y=9×9=81.
If ‘x’ is time and ‘y’ is the concentration of the products, then the above equation would be the rate (reaction rate) equation.
Here ‘x’ and ‘y’ are called variables i.e. quantities that vary through the course of the experiment.
The variable in our control ‘x’ is called the independent variable. e.g. time. We decide for how long to conduct the experiment and what should be the time intervals between the two observations. We could run the experiment for 1 hour (x) and study the concentration of the products (y) after every 10 mins or we could run the reaction for 30 mins and observe the concentration after every 5 mins.
The variable that changes with x is called the dependent variable. This is not in our control. ’y’ changes as we change ‘x’ and it is the change of ‘y’ that we observe in the experiment. e.g. studying how concentration changes with time.
We can later plot the graph of x vs y and see the pictorial representation of our data. We shall discuss the topic of graphs in the subsequent posts.
FUNCTIONS
Functions are ubiquitous in the study of any physical science. It is therefore very important that we understand this concept correctly.
What is a function?
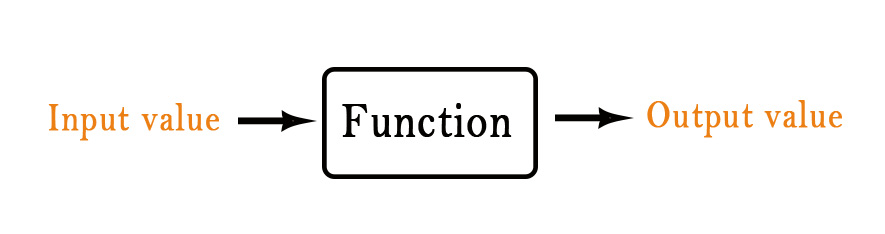
A function is an expression that relates the independent and dependent variables to each other. The independent variable(x) is also called the INPUT. A set of inputs make a DOMAIN.
The dependent variable(y) is called the OUTPUT. A set of outputs is called the RANGE.
A function is commonly denoted as f(x) read as ‘f’ of ‘x’. ‘f’ and ‘x’ are the most used alphabets to denote a function, however, other alphabets(like g,h, a,b etc.) can also be used.
Thus, a function takes the input, acts on it in a specific manner, and gives us a specific output.
For example, consider the following function-

The function f(x) in the example above adds one to any value of x we put in it. If we plug in some values for x, we will get the corresponding output values as follows-
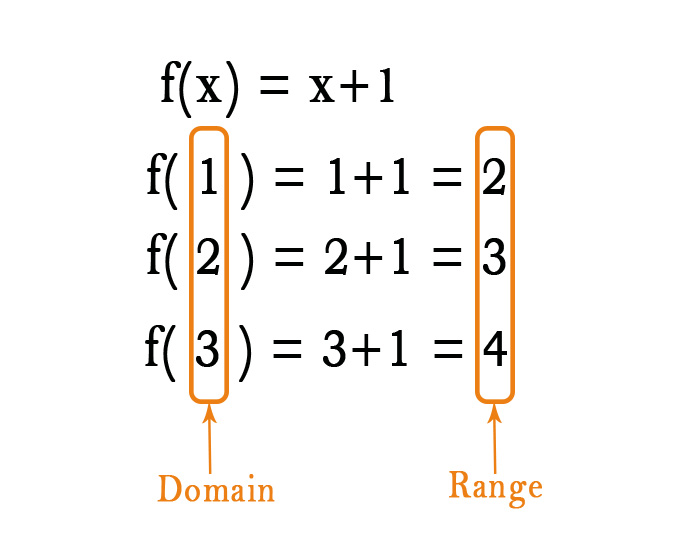
The set of input values is called a domain. The domain is {1,2,3}. The set of output values is called the range. The range is {2,3,4}.
A very important thing to remember is that –

A function always produces a SINGLE OUTPUT VALUE for a given input. If an expression produces more than one output then it is NOT a function.
To understand this let us consider the following set of pairs –
{(positive, 1), (negative,-1), (positive, 2), (negative, -2), (positive, 3), (negative, -3)}
Here we have two quantities in the domain – positive and negative.
The range has 6 entities – 1, -1, 2, -2, 3, -3.

The ‘POSITIVE’ input has 3 output values namely 1,2, and 3.
Similarly, the ‘NEGATIVE’ input has 3 output values namely -1, -2, and -3.
However, a function is an expression that can have ONLY ONE OUTPUT value for a specific input value. Thus, this is NOT a function.
In Chemistry too, we study the dependence of one or more variables of a system on other variables. Thus, we don’t study only two variables but a set of quantities that vary with respect to one another. For example, the volume of the gas is dependent on pressure (P), and temperature(T). A change in any one of the parameters will lead to a change in the volume of the gas. The ideal gas law gives the following relation, which is a function of temperature and pressure –
V = RT/P = f(T,P)

In the above equation, R is a constant. Thus, the values of V, T, and P have specific relationships with one another. This equation is a function. These three sets of values can be graphically plotted on three axes. The resulting diagram is called a PHASE DIAGRAM.

The figure above shows three different sets with different input and output values. The first set is a function, as each input value has a specific output. In the second set, each input value has only one output value too. However, in the third set, the value of b has two outputs – M and N. This defies the condition for a set to be a function. Thus, this is NOT a function.
Types of functions
There are different types of functions. The five basic types of functions are –
| No. | FUNCTION | EXAMPLES | GRAPHS THEY PRODUCE |
| 1. | Linear | y = mx+c | Straight line |
| 2. | Polynomial | y = 2x2+5x+3 y = 3x4 -2x2 – 8x+10 | Smooth continuous curves |
| 3. | Exponential | y = ex y = 10x | Non-linear curves |
| 4. | Logarithmic | y = log e x y = log 2 x | Non-linear curves |
| 5. | Trigonometric | y = sin x y = cos x y = tan x | Sine (sinusoidal/wave) , Cosine, tangent |
Mathematical concepts like slopes, tangents, calculus (derivatives and integration), and statistical interpretations are necessary. They help study, simplify, generalize, and arrange data systematically.
We shall discuss graphs, slopes, and logarithms in the upcoming posts. Till then,
Be a perpetual student of life and keep learning …
Good day!
