In the previous post, we discussed how measurements are subject to errors and the different types of errors that are encountered while collecting data. We shall now proceed to discuss how to measure these errors and how to present our data accordingly.
THE TRUE VALUE
It is imperative that we get ourselves acquainted with the concept of ‘True value – T‘ before we discuss errors.
True value of any parameter is the average value of an infinite number of measured values when average deviation (due to various reasons) approaches to zero.
To understand this definition correctly, we need to know the concept of standard deviation.
Standard deviation gives us an idea of how spread the data is with respect to the mean value. If the standard deviation is less, it means that most of the values measured are closer to that of the mean. This is a good thing, as it indicates that the parameter being studied is showing less discrepancy. If the standard deviation is more, it means that the recorded values are more spread out and show a lot of variations as compared to the mean value.
True value is this ideal value which is ‘supposedly‘ the correct value of the measured parameter. It needs to be calculated. For calculating the true value, we consider a hypothetical situation.We measure infinite number of values for a specific parameter and then assume that the standard deviation approaches zero. This means that the standard deviation – the tendency of the measured values to move away from the mean value- is almost zero. Thus, in this situation all the observed values are extremely close to the mean value.Thus, we arrive at a perfect value which we call the TRUE VALUE for that parameter. This true value attempts to describe that set of data most accurately. This is a hypothetical situation as it is not possible to make infinite observations while conducting any experiment.
True value is generally obtained by finding out the central tendency of a set of data.Mean, Median and Mode are the measures of central tendency. All three are valid and depending on the data set values under study, one chooses the most appropriate of these three to find the true value ,T.
True value ⇒ A single value that describes the set of data ⇒ obtained by finding out central tendency i.e mean/median/mode (generally mean is preferred).
Let us now learn more about the measures of central tendencies of data.
MEASURES OF THE CENTRAL TENDENCY OF DATA
A] Arithmetic Mean –
This is the most popular measure of central tendency and we use it many times in our daily life.The mean is equal to the sum of all the values in the data set divided by the number of values in the data set.
Mean = x̄ = (x1+ x2 +x3+….. + xn ) / n
where,
x1, x2 ,x3, xn. ⇒ values of the set .
and n ⇒ Total no.of values.
It can also be represented as ,
x̄ = ∑x /n.
‘∑’ sign means summation i.e addition of all values.
e.g. Finding the average height of students in a classroom.The height (in cm) of all students in the class are as follows –
132, 135,131,137,133,132,135,136,131,135. What is the average height ?
Mean = (132+135+131+137+133+132+135+136+131+135)/10 = 1337/10 = 133.7 cm.
Thus, the mean value here is 133.7cm.
In the above example the mean value,133.7, is kind of representative of all other data values in that set (as all other values are close to 133.7). It gives us a rough idea of the height of each student in that classroom.
Let us try to find average height of employees in an office .The heights(in cm) are as follows –
142,165,175,188,170,155,178,149,152,151.
Mean = 142+165+175+188+170+155+178+149+152+151/10 = 1625/10= 162.5cm.
Now the value ‘162.5 cm’ is NOT giving us idea of the height of all employees correctly as some values are far too greater than 162.5.The value 178 is greater and 142 is very low ! So, in this case finding the mean is not helpful. In such situations we opt for another measure – median or mode.
B] Median –
Median means ‘situated in the middle’.Here, we arrange all the values in ascending order and then find the middle value .
e.g. In the above example , we arrange values starting from lowest to the highest.
142,149,151,152,155,165,170,175,178,188 .
We have 10 values (even number) so we have two middle values – 155 and 165. So, we use the mean of these two values.
Median = (155+165)/2 = 160.
In case of odd number of values we can easily pick the central value.
C] Mode –
The value which has the highest frequency of occurrence in the data set is the mode.
e.g. – If the values in a data set are 6,8,9,3,7,9,2,1,2,9. Here number ‘9’ has the highest frequency of occurrence. So, the mode is 9 .
Mode as a form of central tendency is not used widely because most of the times it is impractical to find it. As seen in the earlier example, where the data set consists of heights of students, we don’t have a value that repeats itself. In such a case, one cannot find the mode.
Now that we know how to find the true value (T) for a data set , we can go ahead and study the errors. Errors show us the departure of measured value from the true value(T).
CALCULATION OF ERRORS
Calculation of errors can be done in the following ways –
- Absolute Error –
The difference between the measured value and the true value gives us the absolute error.
A.E = xi – T
A.E ⇒ Absolute error.
xi ⇒ Measured Value.
T ⇒ True/Accepted Value.
Absolute error could be positive or negative. If the measured value is more than the true value we get a positive error and if it is less than T then we get a negative error.
e.g. Suppose, the true value of length of a stick is 12cm. After measurement,
person A finds it to be 12.2cm then, (A.E)1 = 12.2 – 12 = +0.2cm (positive error).
person B finds it to be 11.9cm then, (A.E)2 = 11.9 – 12 = -0.1 cm (negative error).
person C finds it to be 11.8cm then, (A.E)3 = 11.8-12 = -0.2 cm (negative error).
2.Mean Absolute Error –
This is found by taking the average of the magnitudes (+ or -ve sign is not taken into account) of all absolute errors.
Mean absolute error =(A.E)m= {⎮(A.E)1⎮+⎮(A.E)2⎮+…..+⎮(A.E)n⎮}/n
Mean absolute error =(A.E)m= {⎮(A.E)1⎮+⎮(A.E)2⎮+⎮(A.E)3⎮}/3 =(0.2+0.1+0.2)/3 = 0.5/3 ≈0.167.
‘⎮A.E⎮’ ⇒ Magnitude of Absolute error (+/- sign of the error is not considered).
The mean absolute error is always positive.
3.Relative Error –
Let us try to understand the concept of relative error with an example.
Suppose a shopkeeper is asked to weigh a bag full of rice and another bag full of wheat. He weighs both the bags.
Weight of the rice bag is 5kgs and that of the wheat bag is 20kg. However, some error is introduced while making the measurements. For the rice bag the error is around 0.5kg and for the wheat bag the error is roughly 1kg.
Weight of the rice bag = 5kg ± 0.5kg. Here absolute error is ±0.5kg i.e the weight could be 4.5, 5 or 5.5 kg.
Weight of the wheat bag = 20kg ± 1kg. Here the absolute error is ±2kg i.e the weight could be 19, 20, 21 kg.
In which of the above measurements has the shopkeeper incurred more error? To find the answer to this question, we need to compute the relative error in both cases.
Relative Error (R.E) = Absolute error/True value = (xi – T)/T.
Relative error in ppt = [(xi – T)/T]× 1000 (ppt = parts per thousand).
Relative error in pph = [(xi – T)/T]× 100 (pph = parts per hundred).
Plugging values in the above example ,
for the rice, R.E in pph = (0.5/5)×100 = 10% relative error.
for the wheat,R.E in pph = (1/20)×100 =5% relative error.
So, though A.E (wheat) > A.E(rice) , R.E(wheat)< R.E(Rice).
Thus, relative error tells us how much is the error in relation to the true value.
Relative error is defined as the ratio of the absolute error of the measured value to the actual measured value.
4.Constant / Zero error –
It is customary to set the instrument to zero before starting any experiment. Sometimes, the device may read slightly higher or lower than the actual zero. In such cases, where the instrument cannot be set to zero or calibrated, the difference is added or subtracted from each observation later. In such cases, the A.E remains constant but R.E changes with the change in sample size.
e.g. During a titration, the burette adds 0.1cm3 extra every time. So, the absolute error for any measurement will be +0.1cm3. Although, the relative error will decrease with increase in sample size as follows –
|
Absolute Error |
Titre Value | Relative Error (in pph) |
|
0.1cm3 |
50cm3 |
0.2% |
|
0.1cm3 |
10cm3 |
1% |
|
0.1cm3 |
1cm3 |
10% |
Relative error (pph) = (Absolute error / True value)×100.
In the above example,
for the first case, R.E = (0.1/50) × 100 = 0.2%. The titre value (the volume of the titrant delivered by the burette) is considered as the true value as that is the exact quantity which is required to reach the endpoint. The titre values for three different titrations are mentioned above.
Thus, Sample size ↑ R.E ↓ for zero error.
5.Proportionate error –
Here, the amount of error will always be a consistent percentage. The magnitude of relative error i.e ⎮R.E⎮ remains constant. Absolute error changes with sample size.
e.g.- Determination of lead in a sample with barium impurity –
Consider an experiment performed to isolate lead as lead sulphate(PbSO4) in a sample.The sample contains Barium as an impurity. During the course of the experiment, Barium also precipitates as barium sulphate (BaSO4).
|
Sample Size |
Amount of PbSO4 + BaSO4 |
Absolute error i.e amount of BaSO4 |
Relative error. |
0.5g = 500mg |
100mg+2mg |
2mg |
(2/500)× 100 = 4% |
|
1g = 1000mg |
200mg+4mg |
4mg | (4/1000)× 100= 4% |
|
0.25g=250mg |
50mg+1mg |
1mg | (1/250) ×100 = 4% |
Note →
In the above example the ratio of amt of BaSO4 / amt of PbSO4 , remains constant (2mg/100mg = 4mg/200mg = 1mg/50mg).
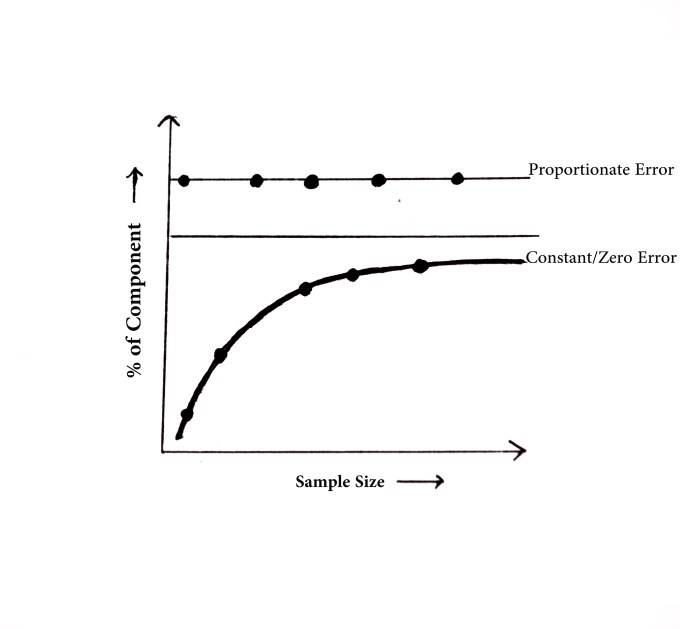
As seen in the figure above, the zero error changes with change in the sample size.However, the proportionate error remains constant.
In the next post , we shall discuss two very important parameters related to this topic. Till then,
Be a perpetual student of life and keep learning …
Good day !
References and Further Reading –
1) https://statistics.laerd.com/statistical-guides/measures-central-tendency-mean-mode-median.php
2)http://www.ehow.com/info_12216420_constant-error.html
3)http://www.ehow.com/info_12185218_difference-between-constant-proportional-error.html
