We start this post with the introduction of two new parameters in error analysis namely – ACCURACY & PRECISION.
ACCURACY
- Accuracy of a measurement tells us how close the measured value (xi), is close to the true/accepted value.
- Accuracy is measured in relative error and absolute error.
PRECISION
- It means reproducibility or repeatability.
- It’s the agreement between two or more values of the same set of observations.
- Precision is measured in terms of deviation.
To understand these concepts let us take example of an archer and the target.

The archer’s aim is to hit the bull’s-eye i.e the exact centre of the target board.
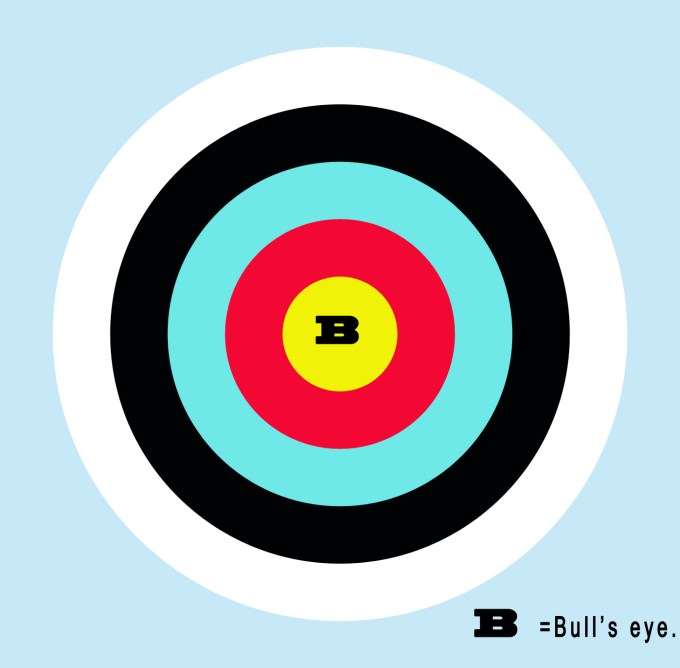
Suppose he shoots 4 arrows, they could land up as follows –
(Green spots ⇒ Region where each arrow hits the board).
CASE I – The arrows shot are far away from the bull’s-eye (centre) but all 4 of them hit the board near a particular spot. In this case, the archer is precise as he hits the target board in a particular region of the board. However, he is not accurate as he is far away from the centre.

CASE II – The arrows shot are very near the bull’s eye but the spots are not in a specific region. They are dispersed. So, the archer here is accurate but not very precise.

CASE III – The arrows shot in this case are both accurate and precise. All 4 arrows are hit in the centre and are very close to each other (all 4 shots are overlapping in the figure below).

In this case, the arrows would look as shown in the figure below –

How to Remember?
- aCcurate is Correct (the bulls eye).
- pRecise is Repeating (hitting the same spot repeatedly).
Good precision does not ensure a fairly good degree of accuracy but, a good degree of accuracy always ensures an equally good degree of precision.
If we have many methods to conduct an experiment, we would obviously choose the one which gives us the most accurate and precise results.
Consider an experiment, which can be conducted in four different ways/methods namely A, B, C & D. We get our results and plot them as shown in the figure below –
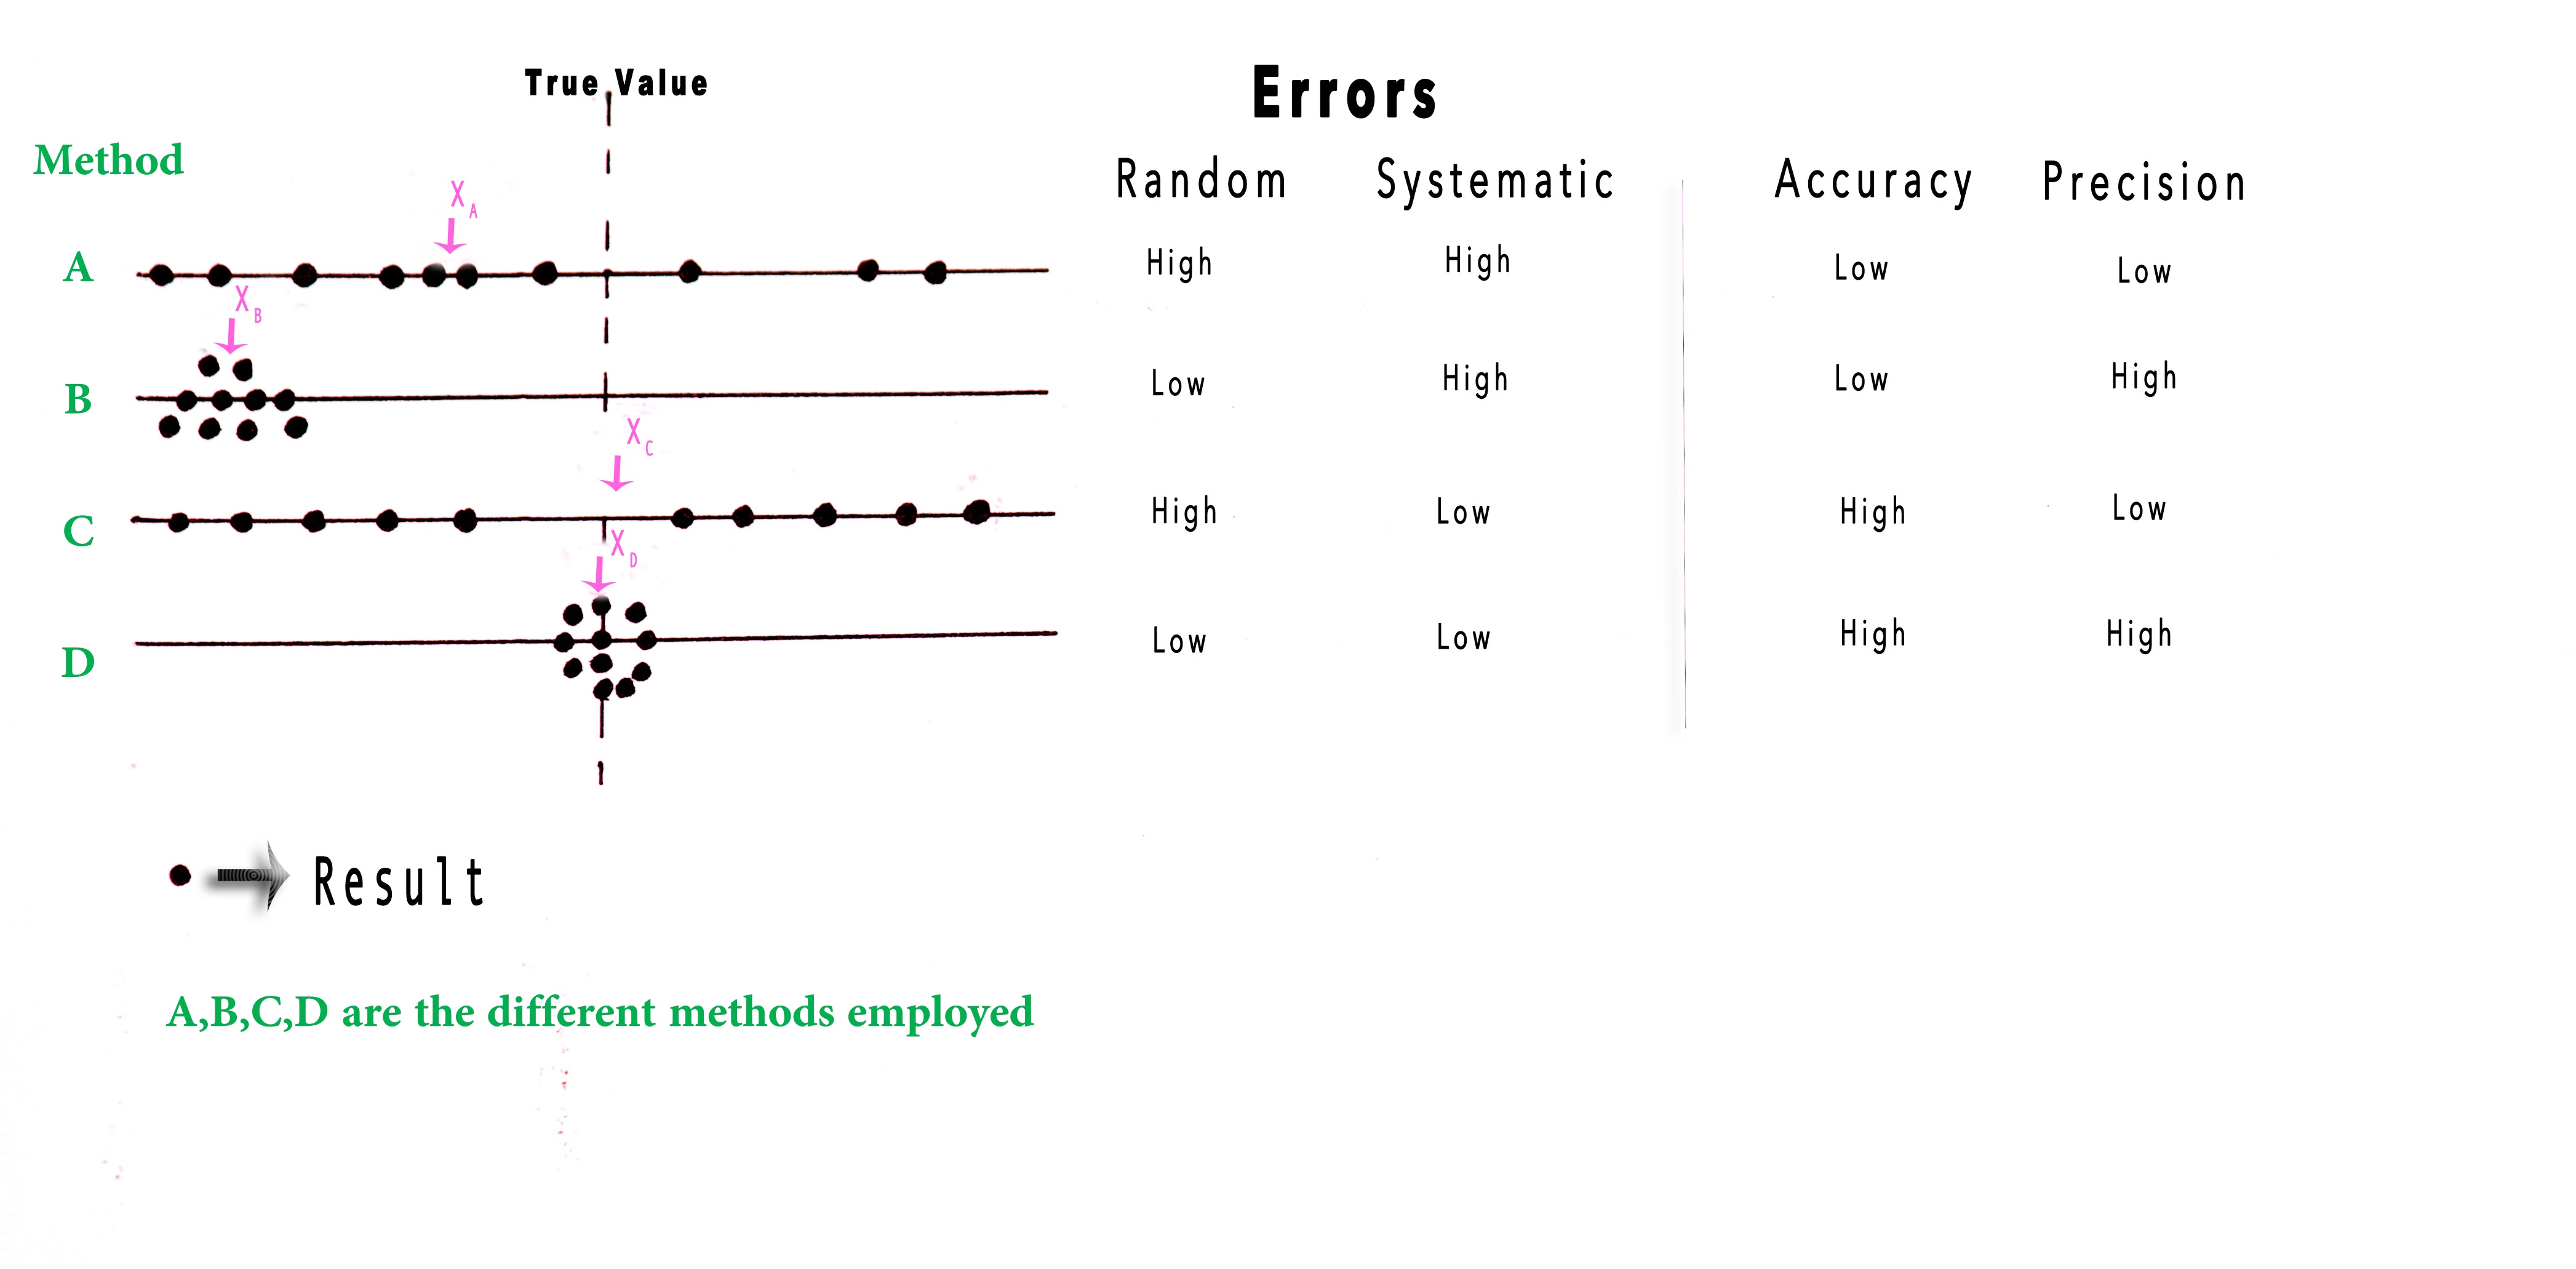
XA, XB, XC, and XD are the respective mean values. In the first two scenarios, the mean values (XA and XB) are not close to the true value. Thus, results obtained using methods A and B cannot be accurate. In the third case, it is only a matter of luck that XC is close to the true value (in this case the accuracy is high). However, the individual results are scattered and far away from the true value. Thus, method C cannot be considered a good way to conduct the experiment. When the experiment is conducted using method D, all the values are near the true value. Naturally, in this case the mean XD is also extremely close to the true value. Therefore, the experiment should be conducted using method D.
Let us talk about errors in the above experiments. Scatter is the result of Random error. Thus, in the above figure, we encounter random errors in methods where the results are scattered in both directions (+ve and -ve), from the true value. Method A and C have random errors in them. Systematic error is encountered when the results are not near the true/accepted value. So we encounter systematic error the most in method B.
With all this information, we would obviously choose method D to conduct our experiment. This method promises high precision and high accuracy! All the results are near the true/accepted value and both types of errors are minimal.
These concepts are useful in laboratories where high-quality work is expected e.g. Processes requiring testing high purity of materials. In such cases, even a little error could cost millions of dollars!
Now that we looked into the concepts of accuracy and precision, we shall discuss how to measure these parameters in the next post.Till then ,
Be a perpetual student of life… Keep learning!
Good day!
References and Further Reading –
1)http://www.mathsisfun.com/accuracy-precision.html
2)http://www.csudh.edu/oliver/che230/textbook/ch05.htm
