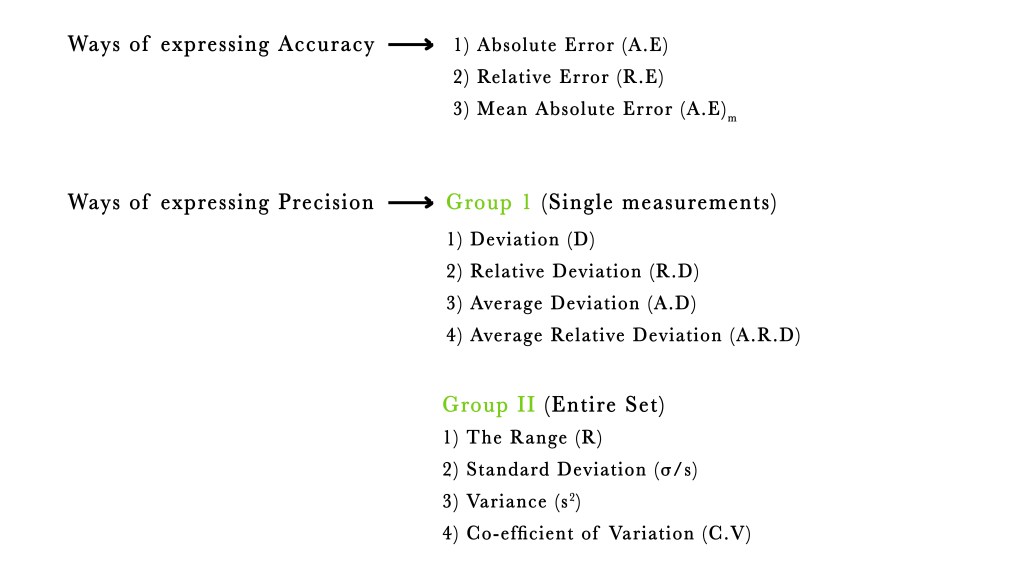
We have been studying all about errors in the last few posts.We continue our discussion further and talk in greater detail about ways of expressing accuracy and precision in this post.
Before diving deeper into this topic, let’s do a quick recap of what we studied in post 15. We learnt how to calculate absolute and relative error –
A.E = xi – T
where,
A.E ⇒ Absolute error.
xi ⇒ Measured Value.
T ⇒ True/Accepted Value
and
Relative Error (R.E) = Absolute error/True value = (xi – T)/T.
Relative error in ppt = [(xi – T)/T]× 1000 (ppt = parts per thousand).
Relative error in pph = [(xi – T)/T]× 100 (pph = parts per hundred).
So we are acquainted with the methods of calculating accuracy. In this post we will learn ways to calculate precision.
WAYS TO CALCULATE PRECISION
The deviation is used to study precision. Deviation tells us how widely spread the data is from the mean value. This concept tells us how much the data points are away from the mean value of that set. The greater the deviation, the less the precision. In other words, if data values are precise i.e. close to each other, deviation will be low.
We study precision in the following ways –
GROUP I
The following parameters help us to find how precise the measurements are for single measurements.
A] Absolute Deviation / Deviation (D) – Deviation shows us how much a given value differs from the mean value.
D= |Xi – Xmean|
D = Deviation.
Xi= Observed value.
Xmean=Mean value.
These lines ‘|| ‘ indicate the ABSOLUTE VALUE of any measurement. Thus, we only consider the value and neglect the sign(+ or –).
e.g.- The absolute value of -6 = |-6| = 6.
Suppose we have the following as our observed values – 8, 10, 12, 12, 10,10 for a hypothetical experiment.
The mean will be the sum of all these values divided by the number of observations.
Xmean = (8+10+12+12+10+10 )/ 6 = 62/6 = 10.33.
The deviations will be as follows –
| Observed value | Mean | Deviation |
| 8 | 10.33 | |8- 10.33| = 2.33 |
| 10 | 10.33 | |10 – 10.33|= 0.33 |
| 12 | 10.33 | |12 – 10.33|= 1.67 |
| 12 | 10.33 | |12 – 10.33|= 1.67 |
| 10 | 10.33 | |10 – 10.33|= 0.33 |
| 10 | 10.33 | |10 – 10.33|= 0.33 |
B]Relative Deviation(R.D) – We saw the significance of relative error in post 15. The same explanation applies to relative deviation too.
R.D = D/Xmean .
| Observed value | Mean | Deviation | Relative Deviation |
| 8 | 10.33 | |8- 10.33| = 2.33 | 2.33 / 10.33 = 0.23 |
| 10 | 10.33 | |10 – 10.33|= 0.33 | 0.33 / 10.33 = 0.03 |
| 12 | 10.33 | |12 – 10.33|= 1.67 | 1.67 / 10.33 = 162 |
| 12 | 10.33 | |12 – 10.33|= 1.67 | 1.67 / 10.33 = 162 |
| 10 | 10.33 | |10 – 10.33|= 0.33 | 0.33 / 10.33 = 0.03 |
| 10 | 10.33 | |10 – 10.33|= 0.33 | 0.33 / 10.33 = 0.03 |
C] Average Deviation (A.D) – The average or mean of all deviation values gives us the average deviation.
A.D = (D1+D2+D3+……+Dn)/n = ∑D/n, where,
D1,D2,D3⇒ Deviations.
A.D = (2.33 + 0.33 + 1.67 +1.67 +0.33 +0.33)/6 = 6.66 /6 = 1.11
Generally, the precision result is reported as plus or minus the average deviation.
In this case, the result will be reported as 10.33 ± 1.11.
D] Relative average deviation (R.A.D) –
Relative average deviation (R.A.D) = A.D / Xmean.
Relative average deviation in pph =A.D / Xmean × 100.
Relative average deviation in ppt = A.D / Xmean× 1000.
Relative average deviation (R.A.D) = 1.11 / 10.33 = 0.107
Relative average deviation in pph = 0.107 × 100 = 10.74 %
Thus the relative average deviation is 10.74%.
GROUP II
The following parameters help us to find how precise the measurements are for a group of measurements.
A] Range – This gives the difference between the highest and lowest value of the set.
Range= R = Xmax – Xmin.
Considering the above example, the highest value in the (8, 10, 12, 12, 10,10 ) set is 12, and the lowest is 8. Thus,
Range = 12-8 = 4.
B] Standard Deviation – This is a statistical parameter that gives the measure of the spread of data around the mean value. It tells us how the data is clustered around the mean (Xmean) value. So, it can be referred to as the ‘mean of the mean‘.
The greater the standard deviation, the more spread the values from the mean.
For small observations (less than 20 observations) –

For large observations/Population (more than 20 observations)-

s,σ = standard deviation
n = number of observations
𝑥i = observed value
𝑥m = mean value
Note the following points about the two formulas mentioned above –
- Only the denominator is different in the two formulas. For fewer observations we divide by ‘(n-1)‘ and for more observations, we divide by ‘n‘.
- We consider only the magnitude of the value |(Xi – Xm)|.
- There is a reason for squaring the value of (Xi – Xm) in the above formula. To understand this, let us consider four measurements → 4,4,-4,-4. Here, the mean is zero. So, this is NOT a correct measure of the central tendency.

So we consider the absolute values only i.e. ignore the negative sign on the values.
Now , mean = (4+4+4+4)/4 =16/4 = 4.
This gives us the correct value of the central tendency!
Now let us consider another four set of measurements → 7,1,-6,-2.
Mean = (7+1+6+2)/4 =16/4 = 4

Surprisingly the mean of these spread out values is also 4!
So, the mean cannot be the parameter to find out the spread of values. The concept of standard deviation is useful in such cases.
s for the first set of values = √(42 + 42 + 42 + 424) = √(644) = 4.
s for the second set of values = √(72 + 12 + 62 + 224) = √(904) = 4.74.
Here, the standard deviation (s) is more when the results are spread out. So, this parameter correctly gives us information about the data spread.
Typically, the standard deviation is graphically represented by a NORMAL DISTRIBUTION / BELL-SHAPED CURVE. It is called so, as it resembles the shape of a bell.
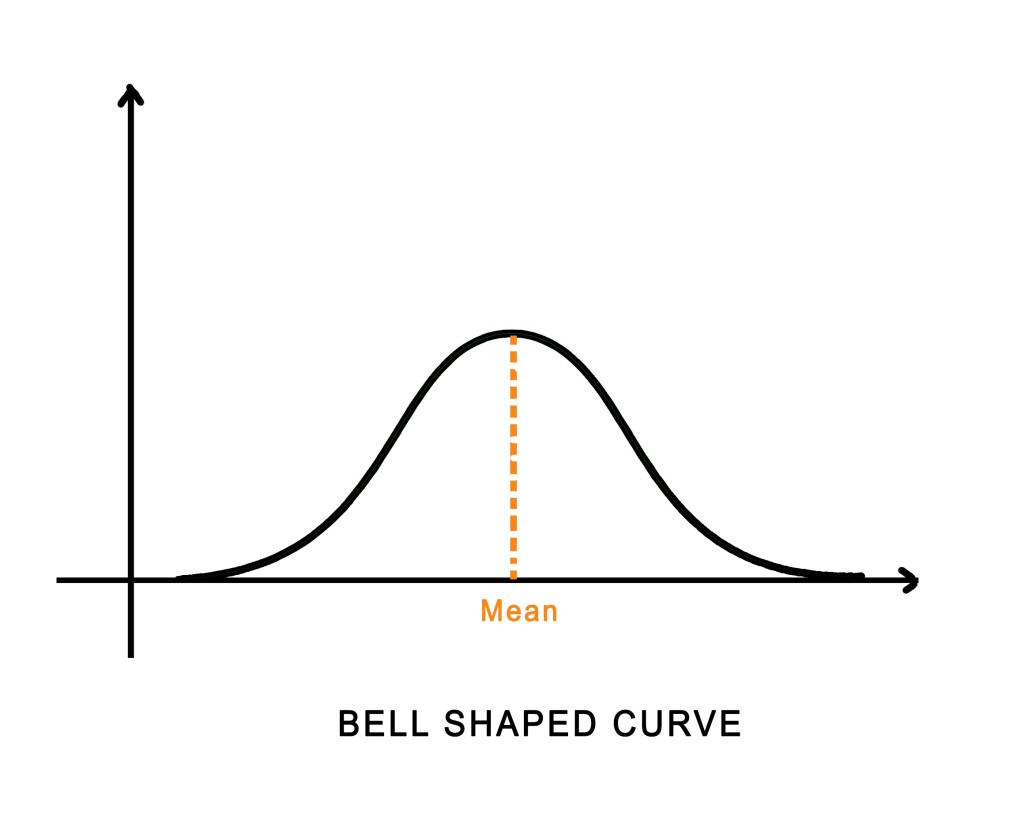
The mean is at the centre and the values are spread on both sides of this mean. If the values are spread equally, we get a symmetric curve like the one shown above. The steepness of the curve gives us an idea of the extent of standard deviation. A steeper curve indicates less standard deviation. This means that the data values are closer to the mean. The graph below shows two curves. The red curve is more spread out with more standard deviation. The green one is more steep. The values are closer to the mean of that curve. Thus, the value of the standard deviation is less in this case.

C] Variance – Variance is the square of standard deviation.
Variance = s2.
D] Coefficient of variance – This helps us to present the variance in percentages.
Coefficient of variance = (s/x)×100.
This post was all about formulas. In my next post, we shall learn the concept behind deviation in greater detail. Till then,
Be a perpetual student of life and keep learning…
Good Day !
References And Further Reading
1)http://www.robertniles.com/stats/stdev.shtml
2)http://www.mathsisfun.com/data/standard-deviation.html
